GCPで使える監視ツールのStackdriverを使ってみました。
Stackdriverは一定量までは無料で使えます。
1.Stackdriverの準備をする
最初にStackdvierのセットアップを行います。
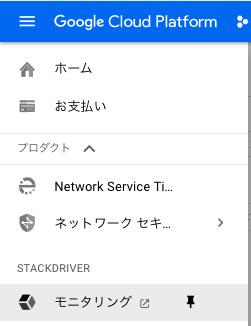
GCPのコンソール上から、「Stackdriver」の「モニタリング」を選択
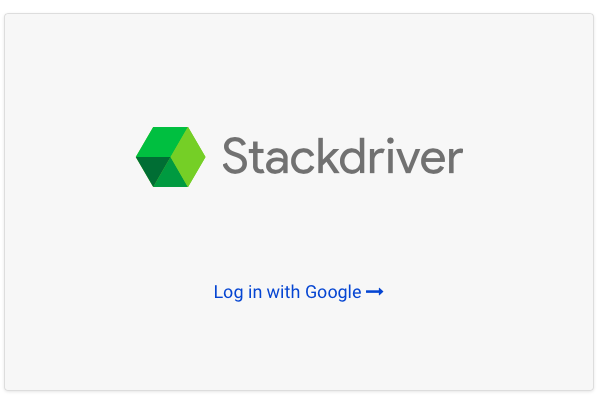
「Log in with google」を選択 ※Safariだとこの画面から先に行かなかったのでChromeを使用しました。
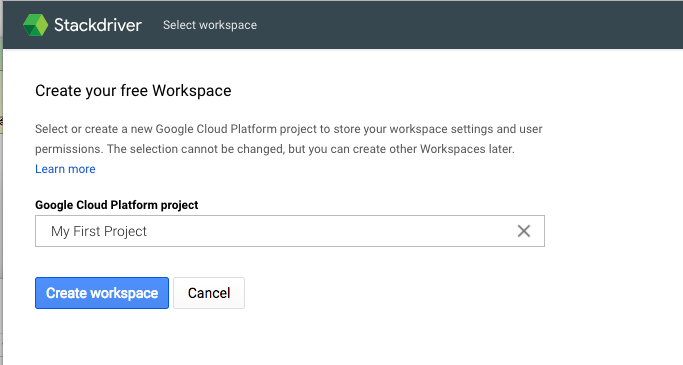
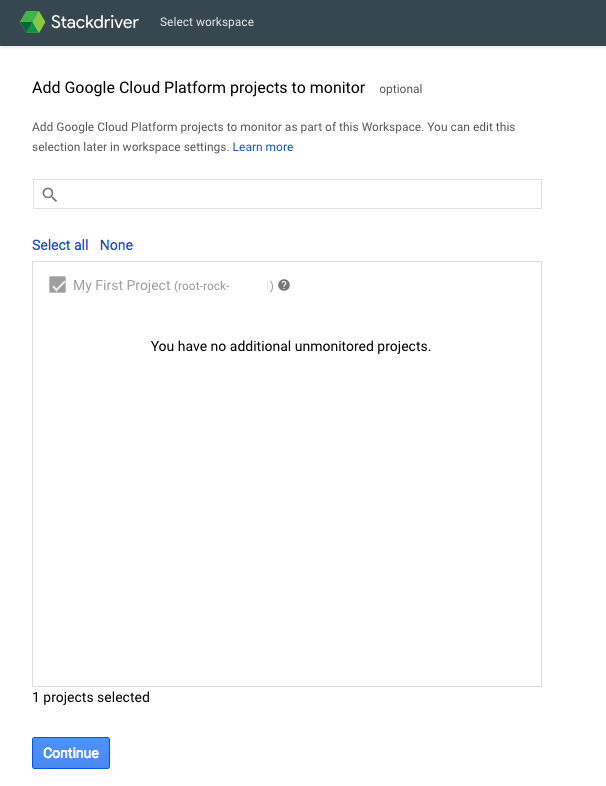
プロジェクトが選択されているのを確認してそのまま「Create workspace」を選択
「Continue」を選択
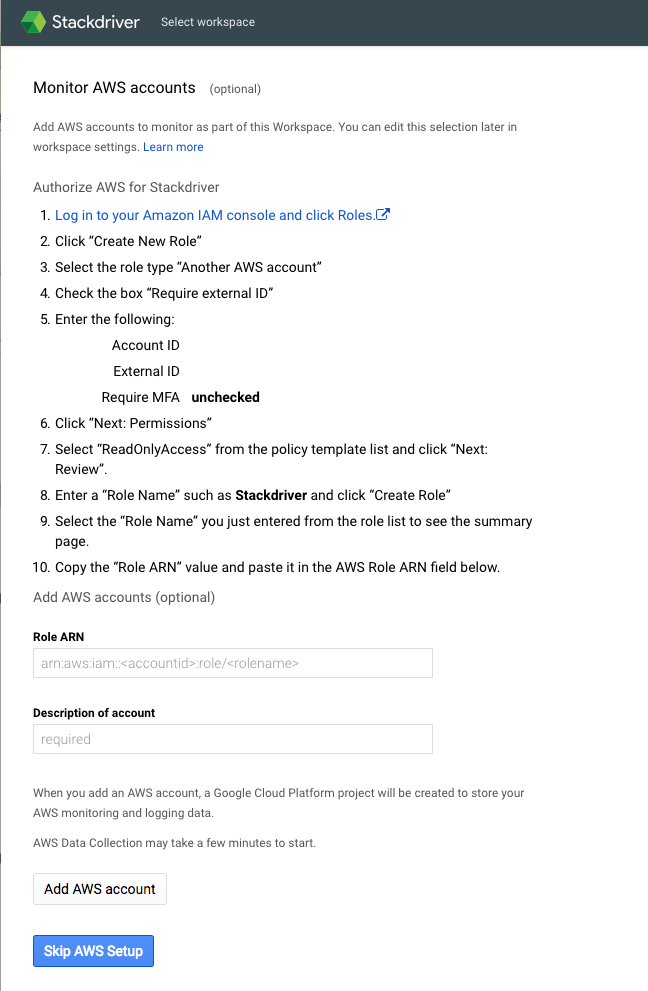
AWSの設定画面が出てきますがAWSは使ってないので「Skip AWS Setup」を選択
Agentをインストールするように指示があるので、

インスタンスにSSHで繋げて、下記4コマンドを実行。
$ curl -sSO https://dl.google.com/cloudagents/install-monitoring-agent.sh
$ sudo bash install-monitoring-agent.sh
$ curl -sSO https://dl.google.com/cloudagents/install-logging-agent.sh
$ sudo bash install-logging-agent.sh
実行結果
$ curl -sSO https://dl.google.com/cloudagents/install-monitoring-agent.sh
$ sudo bash install-monitoring-agent.sh
==============================================================================
Starting installation of stackdriver-agent
==============================================================================
Installing agent for Debian or Ubuntu.
OK
Reading package lists…
Building dependency tree…
Reading state information…
The following packages were automatically installed and are no longer required:
dbconfig-common javascript-common libjs-jquery libjs-sphinxdoc libjs-underscore libuuid-perl php-gettext
php-tcpdf
Use ‘apt-get autoremove’ to remove them.
The following extra packages will be installed:
libpython2.7 libyajl2
Suggested packages:
libpq5 libhiredis0.10 default-jre
The following NEW packages will be installed:
libpython2.7 libyajl2 stackdriver-agent
0 upgraded, 3 newly installed, 0 to remove and 5 not upgraded.
Need to get 2,743 kB of archives.
After this operation, 9,610 kB of additional disk space will be used.
Get:1 http://security.debian.org/ jessie/updates/main libpython2.7 amd64 2.7.9-2+deb8u2 [1,079 kB]
Get:2 http://deb.debian.org/debian/ jessie/main libyajl2 amd64 2.1.0-2 [23.2 kB]
Get:3 http://packages.cloud.google.com/apt/ google-cloud-monitoring-jessie/main stackdriver-agent amd64 5.5.2-382.jessie [1,640 kB]
Fetched 2,743 kB in 2s (1,339 kB/s)
Selecting previously unselected package libpython2.7:amd64.
(Reading database … 47892 files and directories currently installed.)
Preparing to unpack …/libpython2.7_2.7.9-2+deb8u2_amd64.deb …
Unpacking libpython2.7:amd64 (2.7.9-2+deb8u2) …
Selecting previously unselected package libyajl2:amd64.
Preparing to unpack …/libyajl2_2.1.0-2_amd64.deb …
Unpacking libyajl2:amd64 (2.1.0-2) …
Selecting previously unselected package stackdriver-agent.
Preparing to unpack …/stackdriver-agent_5.5.2-382.jessie_amd64.deb …
Unpacking stackdriver-agent (5.5.2-382.jessie) …
Processing triggers for systemd (215-17+deb8u7) …
Setting up libpython2.7:amd64 (2.7.9-2+deb8u2) …
Setting up libyajl2:amd64 (2.1.0-2) …
Setting up stackdriver-agent (5.5.2-382.jessie) …
Processing triggers for libc-bin (2.19-18+deb8u10) …
Processing triggers for systemd (215-17+deb8u7) …
==============================================================================
Installation of stackdriver-agent-5.5.2-382 completed successfully.
Please consult the documentation for troubleshooting advice:
https://cloud.google.com/monitoring/agent
You can monitor the monitoring agent’s logfile at:
/var/log/syslog
==============================================================================
$ curl -sSO https://dl.google.com/cloudagents/install-logging-agent.sh
$ sudo bash install-logging-agent.sh
==============================================================================
Starting installation of google-fluentd
==============================================================================
Installing agents for Debian or Ubuntu.
OK
Selecting previously unselected package google-fluentd.
(Reading database … 48318 files and directories currently installed.)
Preparing to unpack …/google-fluentd_1.5.36-1_amd64.deb …
Unpacking google-fluentd (1.5.36-1) …
Selecting previously unselected package google-fluentd-catch-all-config.
Preparing to unpack …/google-fluentd-catch-all-config_0.7_all.deb …
Unpacking google-fluentd-catch-all-config (0.7) …
Setting up google-fluentd (1.5.36-1) …
Adding system user `google-fluentd’ (UID 109) …
Adding new group `google-fluentd’ (GID 115) …
Adding new user `google-fluentd’ (UID 109) with group `google-fluentd’ …
Not creating home directory `/home/google-fluentd’.
Installing default conffile /etc/google-fluentd/google-fluentd.conf …
Setting up google-fluentd-catch-all-config (0.7) …
Processing triggers for libc-bin (2.19-18+deb8u10) …
==============================================================================
Installation of google-fluentd complete.
Logs from this machine should be visible in the log viewer at:
https://console.cloud.google.com/logs/viewer?project=root-rock-210901&resource=gce_instance/instance_id/3367654606019440183
A test message has been sent to syslog to help verify proper operation.
Please consult the documentation for troubleshooting advice:
https://cloud.google.com/logging/docs/agent
You can monitor the logging agent’s logfile at:
/var/log/google-fluentd/google-fluentd.log
==============================================================================
$
その後、「Continue」を選択。
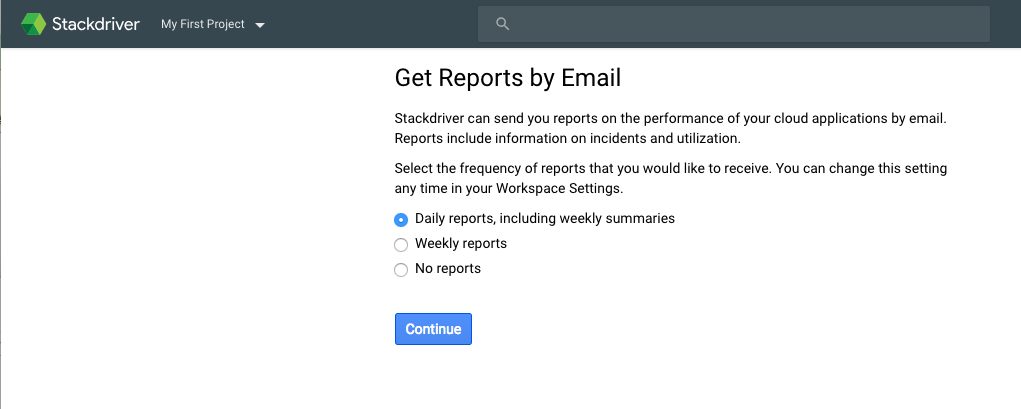
メール通知は適当に選んで「Continue」
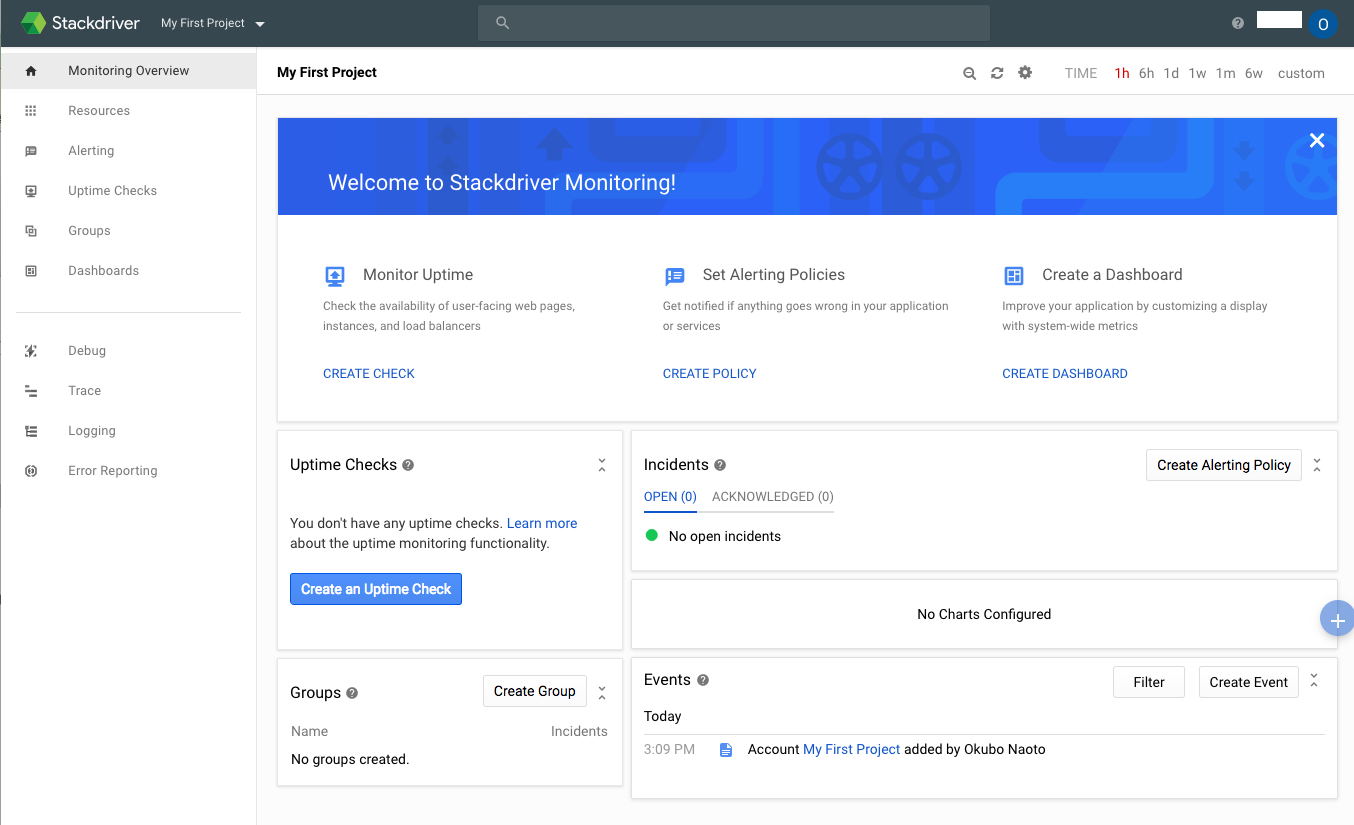
「Launch monitoring」を選択すると、

Stackdriverのトップページが開きます。
2-1.Uptime Checkの作成
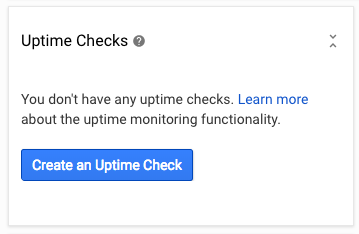
インスタンスの動作状態を監視するUptime Checkを設定します。
Stackdriverのトップページにある「Create an Uptime Check」を設定します。
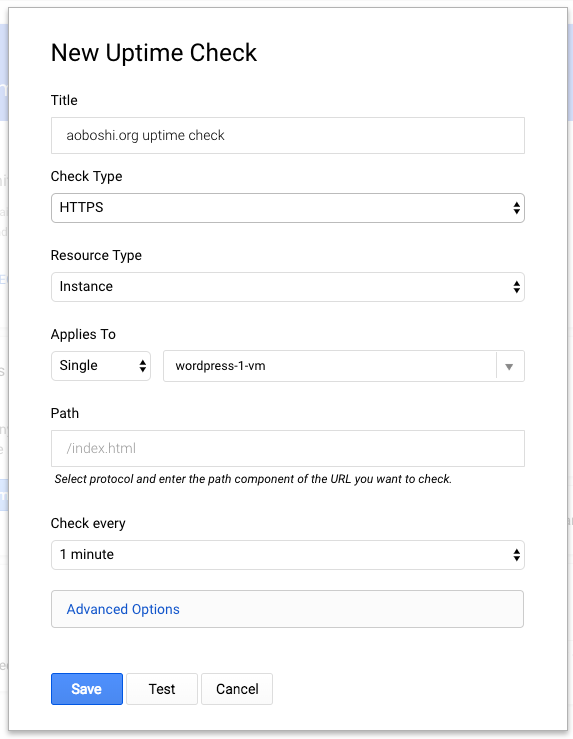
Titleを適当につけ、
「Check Type」は「HTTPS」
「Resource Type」は「Instance」
「Applies To」「Path」は初期のまま、
「Check every」は「1 minutes」にして「Test」を選択します。
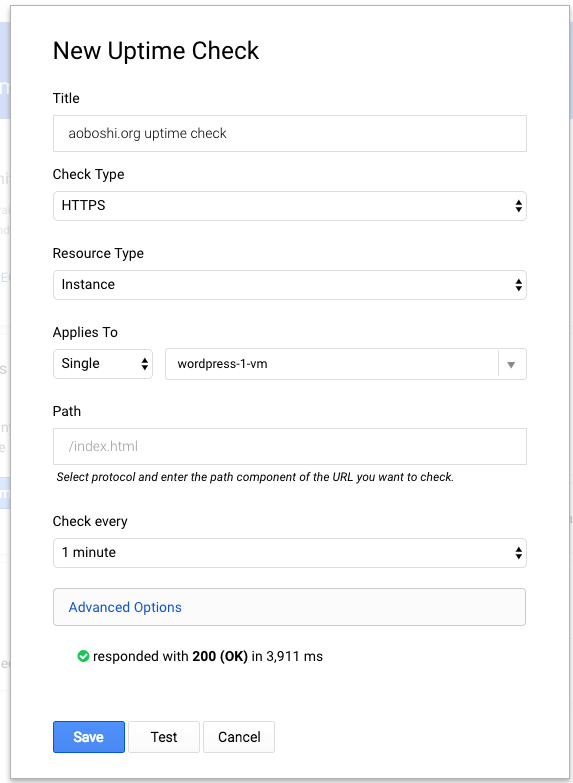
「responded with 200 (OK)」と、正常に動いていることがわかったので、「Save」を選択します。
「Create Alerting Policy」を選択します。
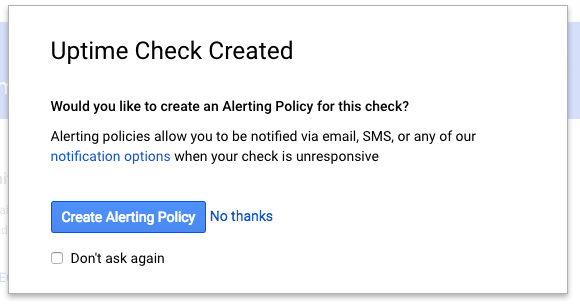
「Add Another Notification」を選択し「Email」を選択、通知を受けとるメールアドレスを入力し、「Save Policy」を選択します。

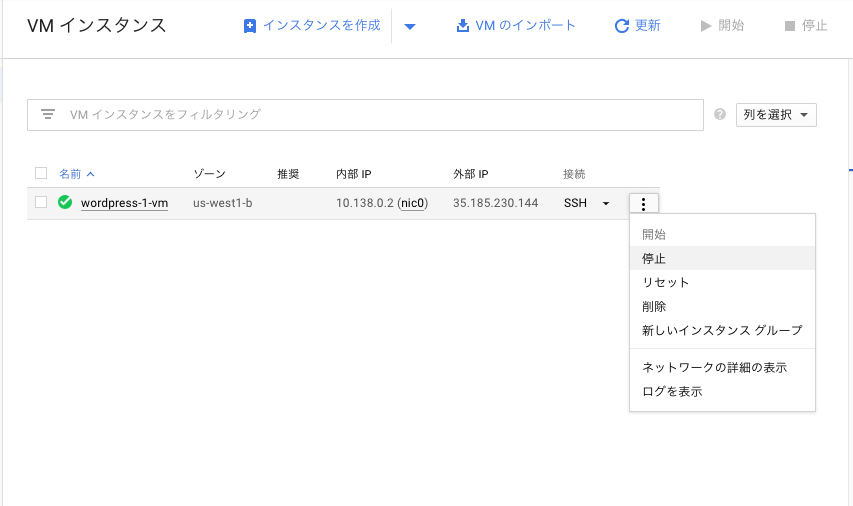
2-1.Uptime Checkの試験
GCPのコンソール上から、インスタンスを落とします。
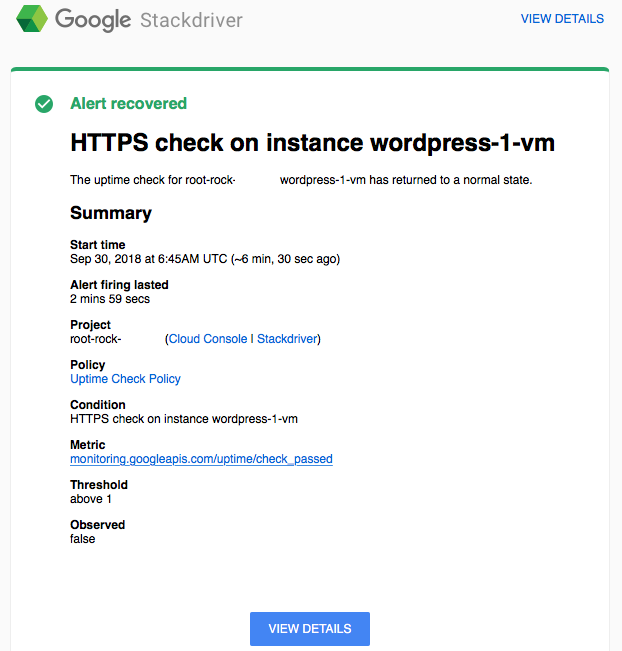
しばらくすると、Stackdriverのトップページにある「Create an Uptime Check」が赤アイコンになり、
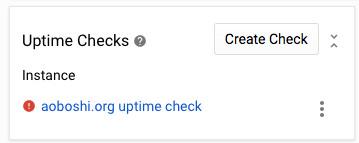
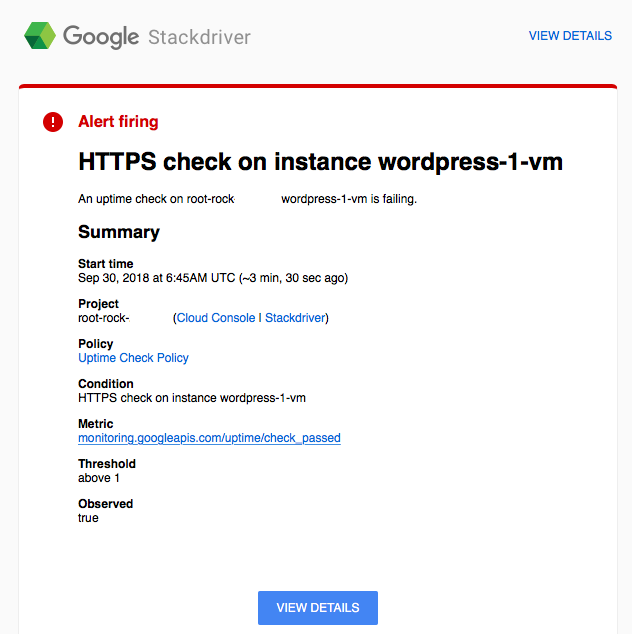
メールで通知が飛んできます、
インスタンスを立ち上げ直してしばらくすると「Create an Uptime Check」が緑アイコンに戻り、
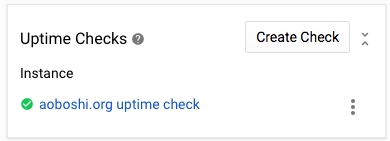
復旧したことを知らせるメール通知が飛んできます。
3.Dashboardの作成
Dashboardを作成し、CPUやメモリなどリソースの状態を見られるようにします。
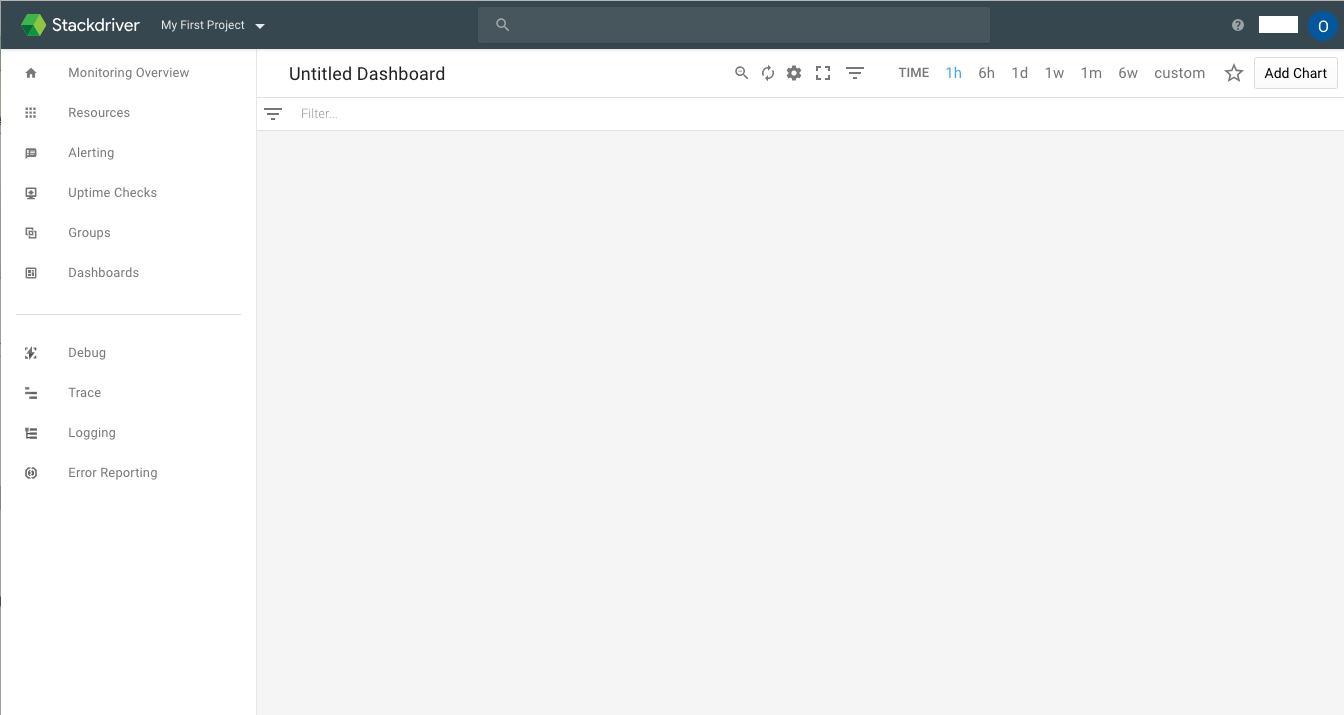
Stackdriverのトップページにある「Dashboards」から「Create Dashboard」を選択

Dashboard画面が開くので、右上の「Add chart」を選択
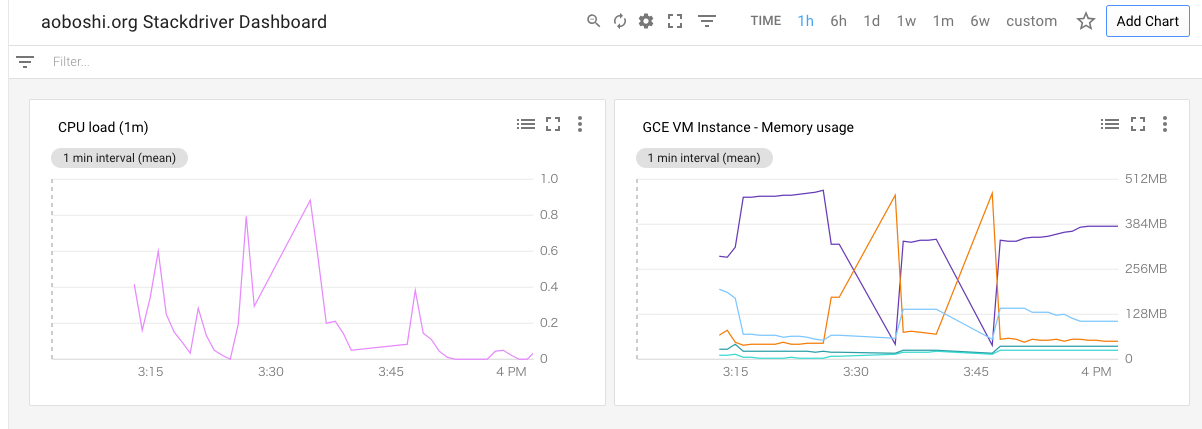
「Find resource type and metric」に「CPU」と入力し、

「CPU load (1m)」を選択し、「SAVE」を選択

再度「Add chart」を選択、「Find resource type and metric」に「mem」と入力し、「Memory usage」を選択、
「SAVE」を選択

CPUとメモリのリソース監視用グラフが完成しました。ついでに「Untitled Dashboard」となっているDashboardの名称もも選択すると編集できるので編集しました。
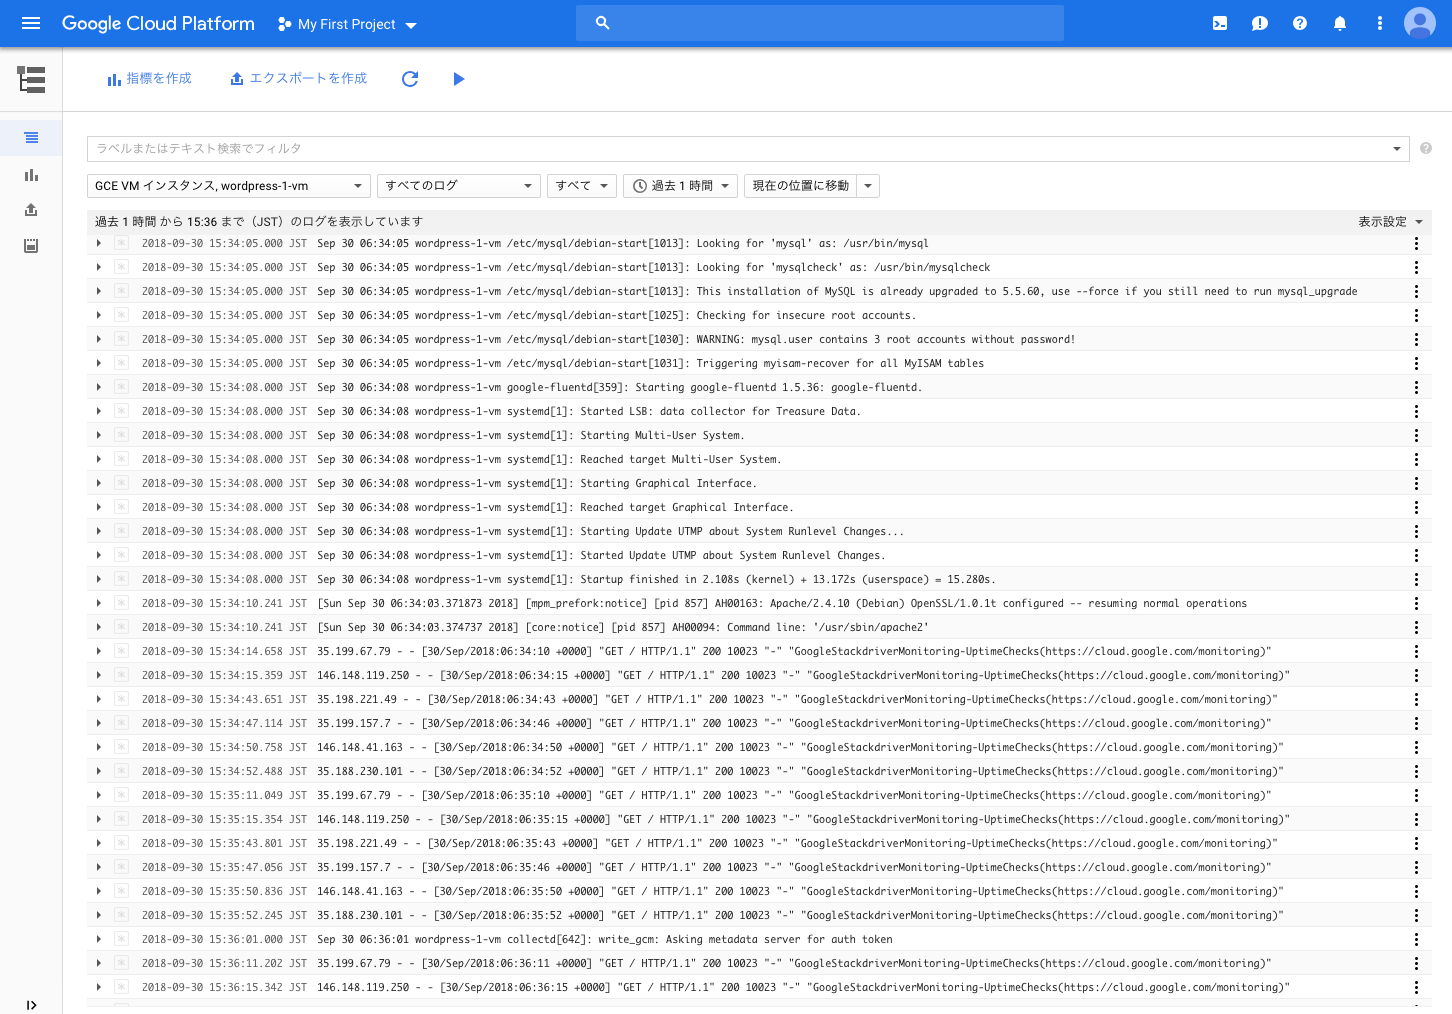
4.インスタンス上の各種ログを確認する
Stackdriverはsyslogやapacheのaccsessログの確認が出来ます。
Stackdriverトップページの「Logging」か、
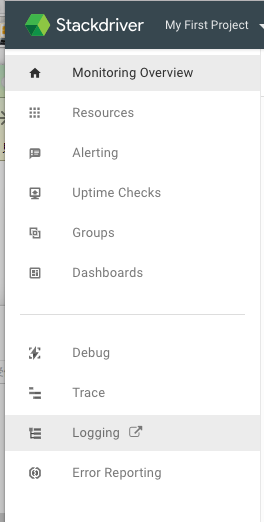
GCPコンソールページの「STACKDRIVER」「Logging」「ログ」
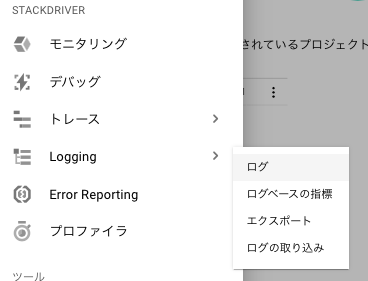
のどちらかで見ることが出来ます。
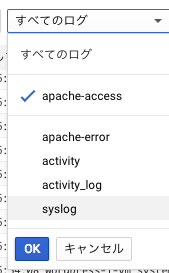
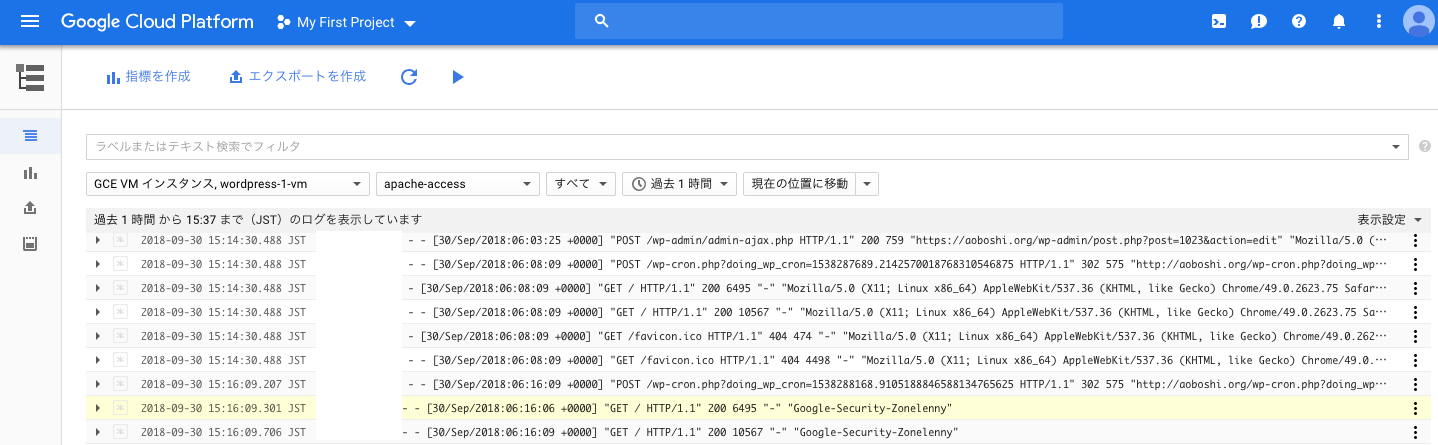
「すべてのログ」を選ぶと、ログの種類を絞ることが出来ます。
以上、さわりだけですが、それでもいろいろと試すことが出来ました。